Seven Days of Earthquakes is an earthquake visualization that reminds us how active our planet is every day.
All data on this page and in the interactive visualization is pulled from the latest available earthquake feed from the USGS. The data consists of all earthquakes from the past seven days that have a magnitude of 2.5 and greater. With the right factors, earthquakes that are M2.5+ have the opportunity to be felt on the earth's surface. The feed is updated regularly every hour or two.
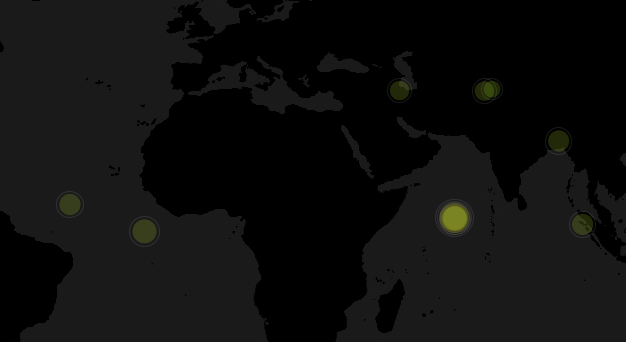
Weak
Moderate
Strong


24 days ago

24 days ago
24 days ago
24 days ago

24 days ago
24 days ago
More about 7DAYSOFEQ
The 7DAYSOFEQ Project started as a very simple data visualization, and grew as a result of discovering the simple power of the data set. The goal of the project is to simplify the way we discover, explore, experience, and interact with the science of earthquakes, in hopes that all can understand how geologically-active the planet we live on actually is. It's also an experiment creating a website that lives, breathes, and reacts to its own data. The project would be nothing without the fantastic power of the open-source application Processing, as well as the data courtesy of the U.S. Geological Survey. If you have any questions or comments, or if you would like to get involved with this project, please feel free to contact me at info@7daysofeq.com